Enterprise web applications support important business activities such as customer management, accounting, inventory operations, employee services, ecommerce transactions and enterprise resource planning. As these applications become more complex, maintaining consistent speed, availability and reliability becomes increasingly important.
A web application may work correctly during development but experience slow responses, database delays or unexpected errors when used by hundreds or thousands of people. Without proper monitoring, identifying the underlying cause can take considerable time.
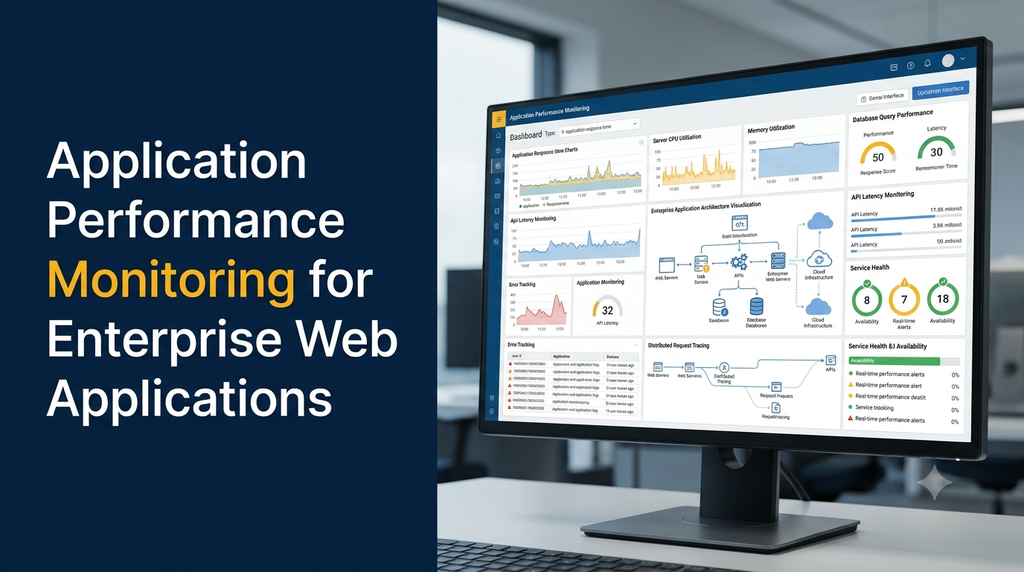
Application performance monitoring (APM) helps businesses understand how their applications behave in real operating conditions. It collects performance information from application requests, servers, databases, APIs and connected services so technical teams can identify problems and improve reliability.
This guide explains enterprise application performance monitoring, its major features, implementation process, monitoring tools, business benefits and important considerations.
What Is Application Performance Monitoring?
Application performance monitoring is the practice of collecting and analyzing technical data about a software application’s performance, availability and behavior.
APM systems help engineering teams understand how quickly requests are processed, where delays occur, which application components generate errors and how infrastructure resources are being used.
A typical monitoring setup can collect information from:
- Frontend web pages and browser interactions
- Backend application services
- Application programming interfaces (APIs)
- Databases and query execution
- Web servers and cloud infrastructure
- Background jobs and scheduled tasks
- External services and integrations
Why Enterprise Web Applications Need APM
Enterprise applications often contain multiple interconnected components. A single customer action may trigger frontend processing, backend services, database queries, external API calls and background tasks.
If any one of these components becomes slow or unavailable, the overall user experience may suffer.
1. Detect performance problems early
Monitoring response times, error rates and resource usage helps teams recognize unusual behavior before it becomes a major operational issue.
2. Improve application response times
Performance information helps developers identify slow database queries, inefficient code paths, unnecessary API requests and infrastructure bottlenecks.
3. Reduce troubleshooting time
Instead of examining every application component manually, engineers can use monitoring traces, logs and metrics to narrow down the source of a problem.
4. Maintain business application availability
Alerts and health monitoring help operations teams respond when important services become unavailable or start behaving unexpectedly.
5. Support application growth
Performance trends help businesses understand how their systems behave as users, transactions, records and integrations increase.
Core Components of Application Performance Monitoring
Enterprise APM usually combines several monitoring methods. Each method provides a different view of application health.
Important Application Performance Metrics to Monitor
Monitoring too many metrics without clear objectives can create unnecessary complexity. Enterprise teams should select indicators that directly relate to application performance and business operations.
| Metric | What it measures | Why it matters |
|---|---|---|
| Response time | Time taken to process a request | Helps identify slow application operations. |
| Throughput | Requests or transactions processed over time | Shows application workload and capacity. |
| Error rate | Percentage or number of failed requests | Helps identify application failures. |
| CPU utilization | Processor resource usage | Highlights compute-related bottlenecks. |
| Memory utilization | Application and server memory consumption | Helps detect memory pressure and inefficient processes. |
| Database query duration | Time required to execute database operations | Identifies slow queries and database bottlenecks. |
| API latency | Time taken by an API to respond | Helps monitor internal and external integrations. |
| Availability | Whether important application services are accessible | Supports operational reliability tracking. |
Understanding the Three Pillars: Metrics, Logs and Traces
Metrics, logs and traces are commonly described as the three pillars of observability. They provide complementary information that helps teams investigate application behavior.
Metrics: What is happening?
Metrics provide numerical measurements over time. For example, an operations team may notice that API response times increased during a particular period.
Logs: What events occurred?
Logs provide records of application events, including errors, warnings, authentication events and processing messages. They help explain what happened during a specific operation.
Traces: Where did the request spend time?
Distributed traces follow a request as it moves through different application services. They help engineers identify which component is responsible for delays or failures.
Application Performance Monitoring vs Infrastructure Monitoring
Infrastructure monitoring and application performance monitoring are related, but they focus on different aspects of a software system.
| Area | Infrastructure monitoring | Application performance monitoring |
|---|---|---|
| Main focus | Servers and infrastructure resources | Application behavior and performance |
| Common metrics | CPU, memory, disk and network | Response time, errors, traces and throughput |
| Typical problems | Server overload and resource exhaustion | Slow requests, application exceptions and inefficient queries |
| Primary users | Infrastructure and operations teams | Developers, operations and engineering teams |
Both approaches are valuable for enterprise systems. Application monitoring can reveal slow business operations even when server resources appear healthy, while infrastructure monitoring helps identify underlying capacity problems.
Popular Application Performance Monitoring Tools
Several monitoring platforms support enterprise applications. Tool selection depends on application architecture, programming languages, deployment environment, monitoring requirements and available budget.
1. Datadog
Datadog provides application performance monitoring, infrastructure monitoring, logs, distributed tracing and cloud observability features. It can help teams analyze connected application and infrastructure data.
2. New Relic
New Relic offers application monitoring, transaction analysis, distributed tracing, browser monitoring and infrastructure visibility.
3. Dynatrace
Dynatrace provides observability capabilities for complex enterprise environments, including application performance analysis, infrastructure monitoring and service dependency visibility.
4. AppDynamics
AppDynamics focuses on application performance and business transaction monitoring, helping enterprises understand the technical behavior of important application workflows.
5. Prometheus and Grafana
Prometheus is widely used for metrics collection and alerting, while Grafana provides dashboards and visualization. They can be combined with other tools for logs and distributed tracing.
6. OpenTelemetry
OpenTelemetry is an open-source observability framework for generating and exporting telemetry data such as traces, metrics and logs. It helps applications send monitoring data to compatible backends.
7. Elastic Observability
Elastic Observability combines logs, metrics, traces and other operational data to help teams investigate application and infrastructure behavior.
No single tool is ideal for every enterprise. Businesses should compare instrumentation requirements, data retention, pricing models, integration support, access controls and operational complexity before selecting a platform.
Application Performance Monitoring for Different Enterprise Systems
ERP applications
Enterprise resource planning systems may contain finance, inventory, purchasing, production and reporting modules. Monitoring should cover critical workflows, database operations, scheduled tasks and integrations between modules.
CRM applications
Customer relationship management systems depend on search, contact records, sales workflows, reporting and third-party integrations. APM can help identify slow searches, delayed API responses and inefficient data operations.
Ecommerce platforms
Ecommerce applications require reliable product browsing, search, cart operations, checkout and payment integrations. Monitoring important customer journeys can help teams identify technical issues that interrupt transactions.
SaaS applications
Multi-tenant SaaS platforms need visibility into shared infrastructure, tenant activity, background jobs and service dependencies. Monitoring should help identify whether a performance issue affects one customer, several tenants or the entire platform.
Customer and employee portals
Business portals may support document downloads, account management, approvals, service requests and reporting. APM helps track the performance of these workflows and connected services.
How to Implement Application Performance Monitoring
An effective APM implementation should begin with business-critical application workflows rather than collecting every possible metric immediately.
- Understand application architecture: Document frontend components, backend services, databases, APIs, external integrations and deployment environments.
- Identify critical workflows: Select important operations such as login, product search, order processing, reporting and payment confirmation.
- Define monitoring objectives: Decide which performance indicators, error conditions and availability requirements need attention.
- Select an appropriate APM platform: Evaluate tool compatibility, features, pricing, data retention and security requirements.
- Instrument application services: Add suitable agents, libraries or OpenTelemetry instrumentation to collect telemetry data.
- Configure dashboards: Create views for application response times, errors, service health, database performance and infrastructure utilization.
- Configure alerts: Set thresholds and notification rules based on meaningful performance conditions.
- Test and validate: Confirm that telemetry is accurate, alerts work correctly and monitoring does not introduce unacceptable overhead.
- Review and improve: Use monitoring information to investigate bottlenecks and prioritize engineering improvements.
Example: Monitoring an Enterprise Web Application Request
Consider an enterprise inventory application where an employee opens a product stock report. The request may pass through several components:
- The employee opens the report from the browser.
- The frontend sends a request to the backend API.
- The backend validates access permissions.
- The application retrieves stock information from the database.
- The server processes the results and returns the response.
- The browser displays the report.
If the report takes longer than expected to load, APM data can help identify whether the delay comes from the API, database query, server processing or frontend rendering.
A distributed trace can connect these stages through a shared trace context, helping engineers investigate the request without manually examining every service.
Example: Adding OpenTelemetry Instrumentation to a Node.js Application
OpenTelemetry can be used to collect application telemetry and export it to a compatible monitoring backend. The following simplified example illustrates the idea of initializing Node.js instrumentation before the application loads.
// instrumentation.js
const { NodeSDK } = require('@opentelemetry/sdk-node');

const sdk = new NodeSDK();

sdk.start();

// Start the application after instrumentation is initialized.
// Example:
// require('./server');
This is only a starting point. A production implementation needs suitable exporters, instrumentation packages, resource attributes, sampling settings and secure telemetry configuration. The monitoring backend must also be configured to receive and process the data.
Real User Monitoring and Synthetic Monitoring
Enterprise teams can combine different monitoring approaches to understand both actual user experience and expected application behavior.
Real User Monitoring (RUM)
RUM collects performance information from actual browser sessions. It can help teams understand page loading, browser errors, navigation behavior and frontend performance across supported devices and networks.
Synthetic monitoring
Synthetic monitoring runs predefined tests against application pages, APIs or important user journeys. It can help identify availability or performance issues even when there is no active user traffic.
Both approaches provide useful information, but they answer different questions. RUM reflects real usage, while synthetic checks provide controlled and repeatable tests.
Application Performance Monitoring Best Practices
- Monitor business-critical transactions: Prioritize workflows that directly support important business operations.
- Use meaningful alerts: Avoid generating notifications for every small fluctuation.
- Track performance trends: Compare current behavior with historical usage and known traffic patterns.
- Connect logs and traces: Use correlation identifiers to make troubleshooting easier.
- Monitor databases and external APIs: Application performance depends on connected services as well as application code.
- Protect sensitive information: Avoid collecting passwords, authentication tokens, payment details or unnecessary personal data in telemetry.
- Control telemetry costs: Review event volume, sampling, retention periods and storage requirements.
- Test alert workflows: Confirm that the right people receive useful notifications and understand how to respond.
- Review monitoring coverage: Update dashboards and alerts when new application modules or services are introduced.
Common APM Implementation Challenges
Complex application architecture
Enterprise systems may contain legacy applications, microservices, external APIs and multiple databases. Instrumentation and service mapping need to account for these dependencies.
Too much monitoring data
Collecting excessive logs and traces can increase storage and processing costs. Teams should define useful telemetry, sampling rules and retention policies.
Unclear alert thresholds
Fixed thresholds may generate unnecessary alerts when normal workloads change. Alert policies should reflect application behavior, service objectives and business impact.
Legacy software limitations
Older applications may not support modern instrumentation libraries. Additional integration work or infrastructure-level monitoring may be needed.
Data privacy and security
Telemetry can contain sensitive application information. Access restrictions, data masking, retention controls and secure transmission should be included in the monitoring design.
Application Performance Monitoring and Cloud Infrastructure
Many enterprise applications operate on cloud infrastructure, container platforms or hybrid environments. Application monitoring becomes more useful when connected with infrastructure metrics.
For example, a slow API may be caused by an overloaded application instance, database connection limits, network latency or an external service dependency. Combining application traces with infrastructure monitoring helps narrow down the cause.
Businesses using cloud-hosted applications should consider monitoring:
- Virtual machine and container resource utilization
- Application service health and restart events
- Database connections and query performance
- Load balancer response and traffic distribution
- Network latency and service communication
- Storage capacity and disk performance
- Deployment changes and application version releases
Application Performance Monitoring Cost in India
APM implementation costs depend on application complexity, the number of services, monitoring tool selection, instrumentation requirements, telemetry volume and ongoing support.
| Service scope | Illustrative planning estimate |
|---|---|
| Basic web application monitoring setup | ₹8,000–₹15,000 |
| Backend application and API monitoring | ₹12,000–₹25,000 |
| Database and server performance monitoring | ₹12,000–₹28,000 |
| Dashboard, alerts and error tracking setup | ₹10,000–₹22,000 |
| Distributed tracing implementation | ₹18,000–₹40,000 |
| Multi-service enterprise APM implementation | ₹35,000–₹90,000+ |
Pricing note: These are illustrative planning estimates, not fixed Greap Technologies quotations or guaranteed market prices. Actual project costs depend on the existing application architecture, monitoring platform, integration effort and required coverage. Third-party APM subscriptions, telemetry ingestion, cloud infrastructure, storage, taxes and ongoing maintenance may be additional.
How to Choose an Application Performance Monitoring Service Provider
Selecting an APM provider or implementation partner requires more than comparing software features. Businesses should evaluate whether the team can understand their application architecture and turn monitoring data into practical improvements.
- Experience with enterprise web applications and backend technologies.
- Knowledge of metrics, logs, distributed tracing and observability.
- Experience with databases, APIs and cloud infrastructure.
- Ability to configure useful dashboards and actionable alerts.
- Understanding of application security and telemetry privacy.
- Clear documentation and handover procedures.
- Ongoing monitoring and troubleshooting support options.
How Greap Technologies Can Help
Greap Technologies provides website development, custom software development and digital growth solutions for businesses. Enterprise web applications often require ongoing technical attention as their users, data and operational requirements increase.
Depending on the application architecture and project requirements, a performance improvement engagement may include:
- Enterprise web application performance assessment
- Backend and API response-time analysis
- Database query and resource utilization review
- Server and cloud infrastructure monitoring configuration
- Application error tracking and diagnostic logging
- Performance dashboards and alert configuration
- Recommendations for application speed and reliability improvements
The monitoring strategy should be designed around actual application workflows, technology choices and business priorities. A focused implementation can help technical teams understand application health and make more informed maintenance decisions.
Need Better Visibility Into Your Enterprise Application Performance?
Discuss your web application architecture, monitoring requirements and performance challenges with Greap Technologies.
Visit Greap Technologies | Discuss Your Requirements on WhatsApp | Call 7092330168
Frequently Asked Questions
1. What is application performance monitoring?
Application performance monitoring is the process of collecting and analyzing application metrics, logs and traces to understand performance, errors, availability and resource usage.
2. Why is APM important for enterprise applications?
APM helps enterprise teams identify slow requests, application errors, database bottlenecks and service failures. It supports faster troubleshooting and more informed performance improvements.
3. What is the difference between APM and observability?
APM focuses on monitoring application performance and transactions. Observability is a broader approach that uses metrics, logs, traces and related signals to understand complex systems.
4. Which metrics should businesses monitor?
Important metrics include response time, throughput, error rate, CPU usage, memory consumption, database query duration, API latency and application availability.
5. What are the popular APM tools?
Common options include Datadog, New Relic, Dynatrace, AppDynamics, Prometheus, Grafana, Elastic Observability and OpenTelemetry-based solutions.
6. Can APM monitor APIs and databases?
Yes. APM solutions can monitor API response times, request failures, database query performance, connection usage and dependencies between application services.
7. What is distributed tracing?
Distributed tracing follows a request across connected application services. It helps developers identify which service or operation contributes to delays or failures.
8. Is OpenTelemetry an APM tool?
OpenTelemetry is an open-source framework for generating and exporting telemetry data. It is commonly used with compatible observability platforms rather than acting as a complete monitoring dashboard by itself.
9. Does application monitoring affect performance?
Instrumentation can introduce some overhead depending on configuration and telemetry volume. Appropriate sampling, selective instrumentation and testing help control its impact.
10. How often should enterprise applications be monitored?
Critical production applications are generally monitored continuously. Teams should also review performance trends, alerts and monitoring coverage regularly as application requirements change.
Conclusion
Enterprise web applications depend on multiple connected components, making performance issues difficult to identify without suitable monitoring. Application performance monitoring provides visibility into response times, application errors, databases, APIs, infrastructure and user experience.
By combining metrics, logs, distributed tracing and infrastructure monitoring, businesses can improve troubleshooting, understand application behavior and make better technical decisions.
For organizations operating ERP platforms, SaaS applications, ecommerce systems and business portals, a well-planned APM strategy is an important part of maintaining reliable and scalable software.