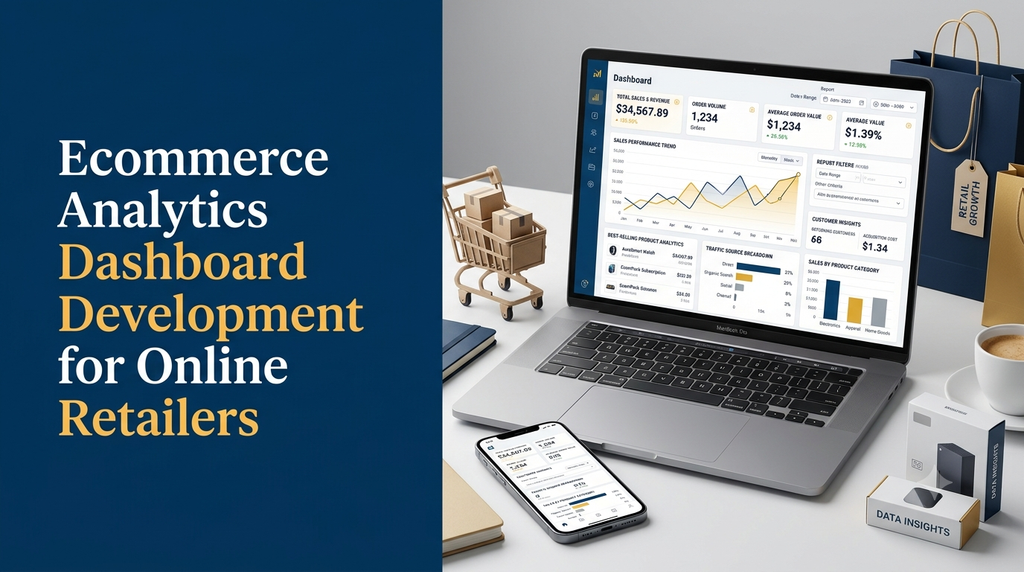
Ecommerce Analytics Dashboard Development for Online Retailers
Track sales, understand customer behaviour, monitor product performance and make better business decisions with a centralised ecommerce analytics dashboard.
Running an online store involves managing products, orders, customers, payments, inventory and marketing activities. As an ecommerce business grows, information becomes spread across multiple platforms and reports. Checking each system separately can make it difficult to understand overall business performance.
An ecommerce analytics dashboard brings important business information together in one place. Store owners and managers can monitor sales, revenue, order trends, customer activity, product performance and inventory metrics through visual reports.
In this guide, we explain ecommerce analytics dashboard development, essential features, important KPIs, data integrations, technology options, implementation stages and estimated development costs for online retailers in India.
What Is Ecommerce Analytics Dashboard Development?
Ecommerce analytics dashboard development is the process of designing and building software that collects, processes and displays information from an online store and its connected business systems.
The dashboard converts raw business data into organised reports, charts, tables and performance indicators. It helps business owners understand what is happening across their ecommerce operations without manually checking multiple systems.
For example, an online retailer may use an analytics dashboard to view:
- Total sales and revenue for a selected period.
- Number of orders and average order value.
- Best-selling and low-performing products.
- New and returning customers.
- Order cancellation and refund trends.
- Inventory levels and stock movement.
- Website traffic and marketing performance.
- Sales by category, location or channel.
A dashboard can be developed as a custom application, an extension of an existing ecommerce platform or a reporting layer connected to multiple business tools.
Why Do Online Retailers Need an Ecommerce Analytics Dashboard?
Analytics is useful for businesses that want to understand performance using reliable information rather than assumptions. A well-designed dashboard helps organise important metrics and makes business reporting easier.
1. Centralised Business Information
Combine relevant information from ecommerce platforms, payment systems, inventory software and marketing tools into a central reporting interface.
2. Better Sales Visibility
Monitor sales trends, order volumes, product revenue and average order values across selected periods.
3. Product Performance Analysis
Identify products that generate revenue, products with low sales activity and categories that need attention.
4. Customer Behaviour Insights
Understand customer acquisition, repeat purchases, purchase frequency and customer segments using appropriately collected data.
5. Inventory Planning
Review stock availability, inventory movement and products that may require replenishment.
6. Marketing Performance Monitoring
Connect relevant marketing data to understand traffic sources, campaign activity and measurable ecommerce outcomes.
7. Faster Reporting
Automate recurring reports and reduce the need to manually combine spreadsheets from different systems.
8. Data-Based Business Decisions
Use historical trends and current operational information to support decisions about products, promotions, stock and customer engagement.
Essential Features of an Ecommerce Analytics Dashboard
The dashboard should be designed around the actual reporting needs of the retailer. The following features are commonly useful for online businesses.
1. Sales Overview Dashboard
Display important sales information such as gross sales, net sales, order count, refunds and sales trends. Clearly define how each metric is calculated so that reports remain consistent.
2. Revenue Analytics
Track revenue across selected periods, product categories, locations and sales channels. The dashboard should distinguish revenue from other measures such as profit and cash received.
3. Order Management Analytics
Monitor order volumes and statuses such as pending, processing, completed, cancelled, returned and refunded. This can help managers understand operational workload.
4. Product Performance Reports
Show product-level information including units sold, revenue, order frequency, returns and available stock.
5. Customer Analytics
Display new customers, returning customers, purchase frequency, average order value and other relevant customer metrics.
6. Inventory Analytics
Track stock levels, low-stock products, out-of-stock items, stock movement and inventory valuation where reliable cost data is available.
7. Marketing Analytics
Connect website analytics and campaign data to understand traffic sources, campaign performance and ecommerce conversions.
8. Discount and Coupon Reports
Review coupon usage, discount amounts, promotion performance and the relationship between promotional activity and sales.
9. Returns and Refund Analytics
Measure return volumes, refund amounts, frequently returned products and reasons for returns when those reasons are collected consistently.
10. Date Range Filters
Allow users to view reports for today, yesterday, the last seven days, the last 30 days, a custom period or other useful reporting ranges.
11. Exportable Reports
Allow authorised users to export reports in formats such as CSV, Excel or PDF for further analysis and business reviews.
12. Role-Based Dashboard Access
Provide different views and permissions for business owners, administrators, sales managers, marketing teams and inventory staff.
Important Ecommerce KPIs to Track
Key Performance Indicators (KPIs) help businesses measure important aspects of ecommerce performance. A useful dashboard should focus on metrics that support actual business decisions.
| KPI | What It Measures |
|---|---|
| Total Sales | Sales value based on the store’s defined reporting rules. |
| Net Revenue | Revenue after applicable deductions defined by the reporting model. |
| Total Orders | Number of orders placed during a selected period. |
| Average Order Value | Average value of qualifying orders. |
| Conversion Rate | Percentage of eligible visits or sessions that result in a purchase. |
| Customer Acquisition Cost | Acquisition spending divided by the defined number of acquired customers. |
| Customer Lifetime Value | Estimated or historical value generated by a customer over a defined relationship period. |
| Return Rate | Share of orders or products returned under a clearly defined method. |
| Cart Abandonment Rate | Share of qualifying shopping carts that do not result in an order. |
| Inventory Turnover | How frequently inventory is sold and replenished over a selected period. |
Understanding Important Ecommerce KPI Calculations
Displaying a KPI is not enough. The business should define its calculation method and use the same definition consistently across reports.
1. Average Order Value (AOV)
AOV represents the average value of qualifying orders.
Average Order Value = Total qualifying order value ÷ Number of qualifying orders
Illustrative example: If qualifying order value is ₹2,00,000 across 100 orders, AOV is ₹2,000.
2. Ecommerce Conversion Rate
Conversion rate measures how many eligible visits or sessions result in purchases.
Conversion Rate = (Purchases ÷ Eligible visits or sessions) × 100
The dashboard should clearly state whether it uses users, sessions or another denominator.
3. Customer Acquisition Cost (CAC)
CAC estimates the cost of acquiring customers through a defined marketing or sales activity.
Customer Acquisition Cost = Eligible acquisition expenses ÷ Number of acquired customers
The expense categories and attribution period should be defined before comparing campaigns.
4. Cart Abandonment Rate
This metric estimates the share of qualifying shopping carts that do not result in a completed purchase.
Cart Abandonment Rate = ((Created carts − Converted carts) ÷ Created carts) × 100
Use a consistent cart definition and reporting window when calculating this metric.
5. Inventory Turnover
Inventory turnover helps retailers understand how frequently stock is sold relative to inventory cost.
Inventory Turnover = Cost of Goods Sold ÷ Average Inventory Value
Use consistent inventory valuation methods and matching reporting periods.
Types of Ecommerce Analytics Dashboards
Different teams need different information. A business can create dedicated dashboards for each operational area instead of placing every metric on one crowded screen.
1. Executive Dashboard
Designed for owners and senior managers, this dashboard presents high-level sales, revenue, customer, order and business performance indicators.
2. Sales Analytics Dashboard
Focuses on sales trends, order value, product revenue, category performance, discounts and sales by channel.
3. Customer Analytics Dashboard
Displays new and returning customers, purchase frequency, customer segments and retention-related metrics.
4. Product Analytics Dashboard
Helps product managers understand product sales, category contribution, returns and product-level performance.
5. Inventory Analytics Dashboard
Provides stock availability, low-stock alerts, inventory movement and replenishment information.
6. Marketing Analytics Dashboard
Combines suitable campaign, traffic and conversion information to help marketing teams evaluate their activities.
7. Financial Analytics Dashboard
Displays relevant financial information such as sales, refunds, payment collections, fees and costs. Profit reporting requires reliable expense and product cost data.
Data Sources and Integrations for Ecommerce Analytics
A dashboard becomes more useful when it connects to the systems that generate business data. The integration strategy should account for data accuracy, update frequency and source ownership.
Ecommerce Platform Integration
Connect WooCommerce, Shopify or a custom ecommerce platform to collect product, order, customer and transaction information.
Payment Gateway Integration
Use payment gateway records to reconcile transaction status, successful payments, failures, refunds and settlement information.
Google Analytics 4 Integration
Where configured and consent requirements are met, connect website analytics data to understand traffic, sessions, ecommerce events and acquisition sources.
Google Ads and Marketing Platform Integration
Import relevant advertising and campaign data to compare marketing expenditure with measured ecommerce activity. Attribution should be interpreted carefully because platforms may use different reporting models.
Inventory and ERP Integration
Connect inventory or ERP systems to obtain product costs, stock movement, purchasing and fulfilment information.
CRM Integration
Use CRM data to support customer segmentation, sales follow-ups and customer relationship reporting where permitted.
Shipping and Logistics Integration
Import fulfilment and delivery status information to monitor shipping performance, delayed orders and delivery-related issues.
How Does an Ecommerce Analytics Dashboard Work?
A typical analytics dashboard follows a data collection and reporting workflow.
- Data collection: Information is collected from the ecommerce platform and connected systems through APIs, webhooks or scheduled imports.
- Data validation: Incoming records are checked for missing fields, invalid values and duplicate events.
- Data transformation: Information is converted into consistent formats and business definitions.
- Data storage: Relevant information is stored in a reporting database or data warehouse, depending on project scale.
- Metric calculation: The system calculates sales, order, customer, inventory and marketing metrics.
- Dashboard rendering: Charts, tables, KPI cards and reports display the processed information.
- Filtering and drill-down: Users select date ranges, categories, products or channels to explore the results.
- Scheduled reporting: The system can generate reports at configured intervals and deliver them to authorised recipients.
Real-Time vs Scheduled Ecommerce Analytics
Not every dashboard needs second-by-second updates. The required refresh frequency depends on the business decision and source system.
| Approach | Description | Suitable Use |
|---|---|---|
| Real-time or near-real-time | Updates shortly after source events are received. | Order monitoring and operational alerts. |
| Frequent scheduled updates | Refreshes at configured short intervals. | Sales and inventory monitoring. |
| Daily reporting | Processes data on a daily schedule. | Management reports and daily performance reviews. |
| Historical reporting | Uses stored data for longer-term analysis. | Seasonal trends and business comparisons. |
Source systems may have API limits, processing delays or settlement delays. The dashboard should show when information was last updated so users understand how current each report is.
Custom Ecommerce Analytics Dashboard Development
A custom analytics dashboard is useful when standard platform reports do not provide the required business insights or when information needs to be combined across multiple systems.
A custom solution may include these modules:
1. Data Integration Module
Connects ecommerce platforms, payment gateways, marketing tools, inventory software and other approved data sources.
2. Data Processing Module
Validates, cleans and transforms incoming information into consistent reporting records.
3. Analytics Engine
Calculates business metrics and supports comparisons across dates, categories, products and channels.
4. Dashboard Interface
Displays KPI cards, charts, tables, filters and detailed reports in a responsive interface.
5. Report Management
Allows users to create, export and schedule selected reports.
6. User and Permission Management
Controls who can view, export or manage particular reports and data.
7. Alert Management
Supports configurable alerts for conditions such as low stock, unusual order activity or failed data imports.
Recommended Technology Stack
The technology stack depends on the number of data sources, data volume, refresh frequency, reporting complexity and existing ecommerce infrastructure.
| Technology Area | Possible Technologies |
|---|---|
| Frontend | React, Next.js, Vue.js |
| Backend | Laravel, Node.js, Python |
| Database | PostgreSQL, MySQL |
| Data Processing | Python, scheduled jobs, background queues |
| Visualisation | Chart.js, Apache ECharts, Recharts |
| Data Warehouse | BigQuery, Snowflake or suitable managed data platforms |
| Integrations | REST APIs, webhooks and supported platform connectors |
| Hosting | Suitable cloud or managed server infrastructure |
These are possible technology choices, not mandatory components. A smaller retailer may need only a web application and a relational database, while a multi-store business with high data volumes may require a dedicated data warehouse and processing pipeline.
Data Accuracy and Reporting Challenges
One of the most important parts of analytics dashboard development is ensuring that reports represent the business accurately. Different platforms may calculate similar metrics differently.
1. Duplicate Transactions and Events
Use reliable transaction identifiers and event-processing rules to avoid counting the same order or payment more than once.
2. Different Revenue Definitions
Clarify whether sales figures include taxes, shipping, discounts, cancellations or refunds. Display the definition alongside important financial metrics.
3. Time Zone Differences
Store timestamps consistently and apply the correct business reporting timezone when grouping orders by date.
4. Delayed Data Synchronisation
Track integration status, last successful sync and failed imports. Provide clear warnings when reports are incomplete or delayed.
5. Attribution Differences
Marketing platforms may assign conversions differently. Avoid adding platform figures together without checking attribution definitions and possible overlap.
6. Missing Product Cost Data
Revenue alone cannot establish profit. Reliable product costs, discounts, refunds, shipping expenses and other relevant costs are needed for meaningful profit reporting.
Security and Privacy Requirements
An ecommerce analytics dashboard may contain commercially sensitive business information and customer-related data. It should be developed with suitable access and privacy controls.
- Use secure authentication and session management.
- Implement role-based access control.
- Restrict access to sensitive customer and financial information.
- Encrypt data in transit and protect stored data appropriately.
- Use secure API credentials and rotate them when required.
- Maintain audit logs for important administrative actions.
- Validate and sanitise imported data.
- Use suitable backup and recovery procedures.
- Follow applicable privacy, consent and data-retention requirements.
- Allow data access only to authorised users and services.
How to Measure the Success of an Analytics Dashboard
Dashboard success should be measured by whether it helps people understand and act on business information, not simply by the number of charts it contains.
Useful evaluation criteria include:
- Accuracy and consistency of reported metrics.
- Time required to prepare regular business reports.
- Frequency of successful data synchronisation.
- Time taken to identify operational issues.
- Adoption by relevant business teams.
- Ease of finding important information.
- Dashboard loading and report generation performance.
- Reduction in manual spreadsheet consolidation.
Common Ecommerce Analytics Dashboard Development Mistakes
- Showing too many KPIs: A crowded dashboard makes it difficult to identify important information.
- Using inconsistent metric definitions: Different reports may show different totals for the same period.
- Ignoring data quality: Duplicate orders and missing records can make reports misleading.
- Combining unrelated data: Metrics from different sources should not be compared without understanding their definitions.
- Overlooking user permissions: Not every employee needs access to every report.
- Building without user requirements: Reports should reflect actual business questions and workflows.
- Ignoring mobile usability: Managers may need to review selected reports while away from their desks.
- Skipping integration monitoring: Failed imports can silently create incomplete dashboards.
- Confusing revenue with profit: Profit reporting requires accurate cost and expense data.
Ecommerce Analytics Dashboard Development Cost in India
The cost depends on the number of dashboards, data sources, integrations, reporting requirements, data processing complexity and user permissions.
| Development Type | Illustrative Cost Range |
|---|---|
| Basic ecommerce analytics dashboard | ₹40,000 – ₹80,000 |
| Sales, product and customer reporting dashboard | ₹80,000 – ₹1,50,000 |
| Custom dashboard with multiple integrations | ₹1,50,000 – ₹3,00,000 |
| Advanced analytics platform with data warehouse and automation | ₹3,00,000 onwards |
Note: These are illustrative project-planning estimates, not fixed Greap quotations or guaranteed market prices. Actual costs depend on data volume, source APIs, integration complexity, reporting logic, hosting, security and testing requirements. Third-party platform subscriptions and infrastructure charges may be additional.
How to Choose an Ecommerce Analytics Dashboard Development Company
Choosing a development partner is important because an analytics dashboard needs to connect business systems and represent data accurately.
Before selecting a company, evaluate the following:
- Experience in ecommerce website and software development.
- Understanding of sales, order and customer reporting.
- Experience integrating APIs and third-party platforms.
- Knowledge of database design and data processing.
- Ability to develop clear, responsive dashboard interfaces.
- Understanding of role-based access and data security.
- Testing methods for metric accuracy and integration reliability.
- Availability of maintenance and technical support.
Why Consider Greap Technologies for Ecommerce Analytics Development?
Greap Technologies provides website development, custom software development and digital growth solutions for businesses.
We can help online retailers plan and develop custom analytics dashboards with sales reports, product performance tracking, customer insights, inventory reporting, data visualisation and integrations based on project requirements.
Whether you manage a growing online store, a multi-category ecommerce business or a retail operation with multiple sales channels, a centralised reporting solution can make business information easier to understand.
Our development approach focuses on identifying the right KPIs, understanding your existing systems and building a dashboard around practical business requirements.
Planning an Ecommerce Analytics Dashboard?
Discuss your reporting requirements, data sources and custom software plans with Greap Technologies.
Visit Greap Technologies Discuss Your Project on WhatsApp Call +91 70923 30168Frequently Asked Questions
1. What is an ecommerce analytics dashboard?
An ecommerce analytics dashboard is a reporting interface that displays important online store information such as sales, orders, revenue, customer activity, product performance and inventory metrics.
2. How much does ecommerce analytics dashboard development cost in India?
A basic custom dashboard may start around ₹40,000 in an illustrative project estimate. Advanced dashboards with multiple integrations, automated processing and data warehouse functionality can cost more depending on requirements.
3. What KPIs should an ecommerce dashboard include?
Common KPIs include sales, net revenue, total orders, average order value, conversion rate, customer acquisition cost, customer retention, return rate and inventory turnover.
4. Can an analytics dashboard integrate with WooCommerce?
Yes. A custom dashboard can connect with WooCommerce through supported APIs, webhooks and other integration methods to retrieve relevant product, order and customer information.
5. Can Shopify data be displayed in a custom analytics dashboard?
Yes. A custom dashboard can retrieve suitable Shopify store information through supported APIs and integrations, subject to permissions and platform requirements.
6. Can I combine sales, marketing and inventory reports?
Yes. A dashboard can combine information from ecommerce platforms, analytics tools, advertising platforms and inventory systems when suitable integrations and consistent data definitions are available.
7. Does an ecommerce analytics dashboard support real-time reporting?
It can support real-time or near-real-time reporting when source systems provide timely data and the integration architecture supports frequent updates. Some reports may be better suited to scheduled updates.
8. Can an analytics dashboard generate Excel and PDF reports?
Yes. Custom reporting systems can support CSV, Excel and PDF exports, depending on the required report formats and implementation.
9. What is the difference between revenue and profit in ecommerce analytics?
Revenue represents the value generated from sales under a defined reporting method. Profit accounts for relevant costs and expenses. A reliable profit report needs accurate product costs and other applicable expense data.
10. How long does it take to develop an ecommerce analytics dashboard?
A basic dashboard may take a few weeks, while a custom solution with several integrations, complex reporting and automated data processing may require multiple months. The timeline depends on scope and data readiness.
Conclusion
Ecommerce analytics dashboard development helps online retailers organise important business information and understand performance across sales, products, customers, inventory and marketing.
A useful dashboard does more than display charts. It brings together reliable data, consistent KPI definitions, practical reports and secure access so teams can make informed business decisions.
Whether you need a basic sales dashboard or a custom analytics platform connected to multiple business systems, the right solution should match your store’s size, data sources and reporting requirements.
If you are planning to build an ecommerce analytics dashboard, contact Greap Technologies to discuss a solution for your online retail business.