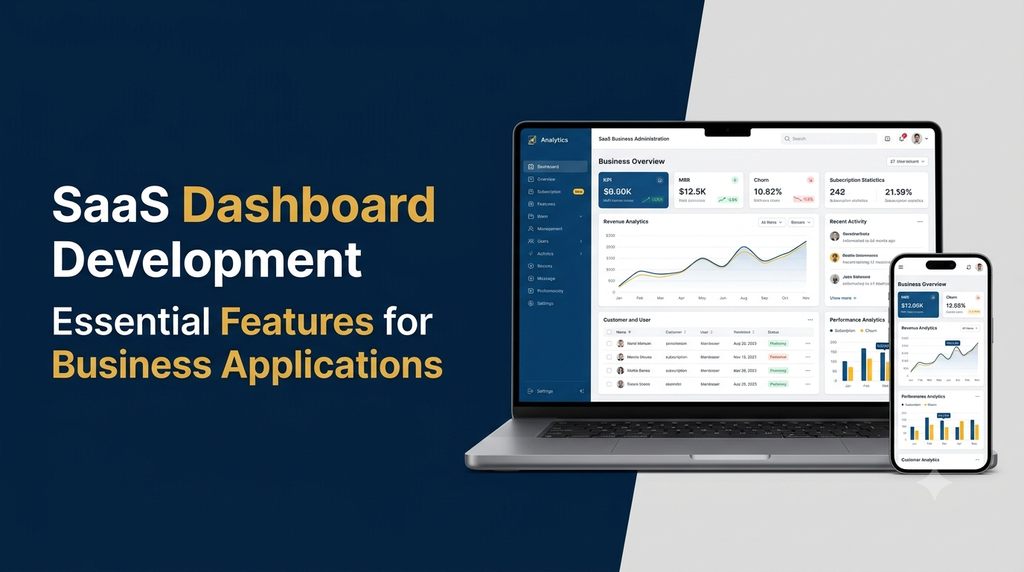
A SaaS dashboard is one of the most important parts of a software-as-a-service application. It gives users a central place to access business information, monitor performance, manage activities and make decisions using real-time or regularly updated data.
Whether you are building a CRM platform, subscription management system, project management application, inventory solution or enterprise SaaS product, the dashboard plays a major role in the overall user experience.
A well-designed dashboard should do more than display charts and numbers. It should help users understand what is happening in their business, identify important activities and complete common tasks without unnecessary navigation.
In this guide, we explore SaaS dashboard development, essential features, dashboard types, UI/UX principles, technology choices, development stages and estimated costs in India.
What Is SaaS Dashboard Development?
SaaS dashboard development is the process of designing and building an interactive interface that allows users to access, monitor and manage information within a cloud-based software application.
A dashboard generally combines data from different application modules and presents it in a structured format using summary cards, charts, tables, filters, activity feeds and reports.
For example, a subscription-based CRM platform may display total customers, active subscriptions, monthly revenue, pending tasks, recent leads and sales performance on its main dashboard.
Why Is a Dashboard Important for Business Applications?
Business applications often contain multiple modules, records and workflows. Without a properly organised dashboard, users may need to open several pages to understand the current status of their operations.
A well-developed dashboard helps businesses:
- Monitor important business performance indicators.
- Access frequently used application features quickly.
- Identify pending activities and operational issues.
- Track customer, sales and subscription information.
- Understand business trends through charts and reports.
- Improve visibility across departments and teams.
- Reduce unnecessary navigation within the application.
Types of SaaS Dashboards
Different users need different information. A SaaS application may include multiple dashboards based on user roles, responsibilities and business requirements.
1. Super Admin Dashboard
The super admin dashboard is designed for the platform owner. It provides central control over users, subscriptions, tenants, application settings, payments and system activity.
Typical features include:
- Total registered customers and tenants.
- Active and inactive subscriptions.
- Revenue and payment summaries.
- User and account management.
- Subscription plan configuration.
- Platform-wide reports and activity logs.
2. Business Admin Dashboard
A business administrator manages the organisation’s account, employees, settings, reports and business activities.
3. Employee Dashboard
An employee dashboard provides access to assigned tasks, personal information, notifications, daily activities and permitted business modules.
4. Customer Dashboard
A customer-facing dashboard allows users to manage their profiles, orders, subscriptions, service requests, documents and account information.
5. Analytics Dashboard
An analytics dashboard presents business metrics and trends using visual reports, charts, comparison tools and configurable date ranges.
6. Reseller Dashboard
White label and reseller SaaS platforms may provide a separate dashboard for partners to manage customer accounts, subscription information and permitted business activities.
Essential Features of a SaaS Dashboard
The following features form a useful foundation for a modern SaaS dashboard. The exact modules should be selected based on the application and its target users.
Advanced Features for Modern SaaS Dashboards
Once the core dashboard is working properly, additional capabilities can make the application more useful for growing businesses.
Customisable Dashboard Widgets
Allow users to choose which widgets appear on their dashboard, reorder selected components or save their preferred dashboard layout.
Real-Time Data Updates
Use suitable technologies such as WebSockets or server-sent events when users need live updates. Not every dashboard requires continuous real-time communication; periodic refresh may be sufficient for many business metrics.
Multi-Tenant Dashboard Support
For multi-tenant SaaS products, each organisation should see its own business information. The dashboard must respect tenant permissions and never expose another organisation’s records.
AI-Assisted Business Insights
Selected applications can use AI to summarise trends, identify unusual patterns or provide natural-language explanations of business data. These insights should be transparent, appropriately permissioned and checked against reliable source data.
Multi-Language Support
Applications serving different regions may provide multiple interface languages. This can include English, Tamil and other languages depending on the target audience.
API Integrations
Integrations can bring information from accounting systems, payment providers, CRM tools, communication platforms and other business applications into a central dashboard.
Important SaaS Dashboard UI/UX Design Principles
A dashboard can contain many features and still be difficult to use if its interface is poorly organised. Good UI/UX design should make important information easy to understand.
1. Clear Information Hierarchy
Display the most important metrics first. Secondary information and detailed reports can be placed further down the page or inside dedicated sections.
2. Simple Navigation
Use a predictable navigation structure with clear labels. Avoid adding too many menu items to the main sidebar.
3. Consistent Design System
Maintain consistent typography, spacing, button styles, colours, icons and component behaviour across the application.
4. Useful Data Visualisation
Choose charts according to the information being displayed. For example, line charts are useful for trends over time, while bar charts help compare categories.
5. Responsive Layout
A desktop dashboard may use a sidebar and multiple columns. On smaller screens, navigation and widgets should adapt without making important information difficult to access.
6. Accessible Interface
Use readable text, sufficient contrast, keyboard-accessible controls, meaningful labels and clear error messages.
7. Helpful Empty States
When an account has no data yet, explain what the user can do next instead of displaying a blank chart or confusing error.
Dashboard Development for Different Business Applications
The dashboard should reflect the actual business workflow rather than using the same set of widgets for every product.
| Application Type | Important Dashboard Features |
|---|---|
| CRM Software | Leads, sales pipeline, customer activity and follow-up tasks. |
| ERP Software | Inventory, purchasing, sales, production and operational reports. |
| Inventory Software | Stock levels, low-stock alerts, product movement and warehouse activity. |
| Project Management | Projects, tasks, deadlines, team workload and progress reports. |
| Subscription SaaS | Active subscriptions, renewals, recurring revenue and payment status. |
| Education Management | Student records, attendance, course activity and fee information. |
| Healthcare Management | Appointments, authorised patient workflows, staff schedules and operational summaries. |
| Manufacturing Software | Production status, quality checks, machine activity and maintenance schedules. |
Technology Stack for SaaS Dashboard Development
The right technology depends on the application’s complexity, expected traffic, integrations and development team’s expertise.
| Development Area | Technology Options |
|---|---|
| Frontend Development | React.js, Next.js, Vue.js |
| Backend Development | Laravel, Node.js, NestJS, Python |
| Database | PostgreSQL, MySQL |
| Charts and Visualisation | Chart.js, Apache ECharts, Recharts |
| UI Components | Tailwind CSS, suitable component libraries |
| Authentication | Secure sessions, OAuth and identity services |
| Real-Time Communication | WebSockets, server-sent events |
| Cloud Hosting | AWS, Google Cloud, Azure or suitable managed hosting |
A business dashboard does not need every technology listed above. A simple reporting interface can be developed with a much smaller stack, while a complex SaaS platform may require additional services.
SaaS Dashboard Development Process
Step 1: Understand Business Requirements
Identify the purpose of the dashboard, its target users, business metrics and the information each role needs to access.
Step 2: Define Dashboard Structure
Plan the navigation, page hierarchy, widgets, reports, filters and role-specific dashboard layouts.
Step 3: Design the User Interface
Create responsive layouts and reusable interface components. Validate the design with representative user workflows.
Step 4: Plan Database and APIs
Identify the required data sources, database tables, API endpoints, reporting queries and permission rules.
Step 5: Develop Frontend and Backend
Implement the dashboard interface, backend business logic, authentication and required application modules.
Step 6: Integrate Charts and Reports
Connect data sources to visual components. Check that displayed figures match the underlying business records.
Step 7: Implement Security
Apply role-based access control, secure API validation, appropriate session management and tenant-level data isolation where required.
Step 8: Test Across Devices
Check dashboard behaviour on desktops, tablets and smartphones. Test filters, exports, permissions and loading performance.
Step 9: Deploy and Monitor
Deploy the application, configure monitoring and backups, and track errors and performance after launch.
SaaS Dashboard Development Cost in India
The cost of SaaS dashboard development depends on the number of screens, user roles, reporting requirements, integrations, data complexity and backend functionality.
| Dashboard Type | Indicative Development Cost | Typical Scope |
|---|---|---|
| Basic Dashboard | ₹75,000 – ₹1.5 lakh | Overview cards, basic charts and limited user access. |
| Business Dashboard | ₹1.5 lakh – ₹3.5 lakh | Multiple modules, filters, user management and reports. |
| Advanced SaaS Dashboard | ₹3.5 lakh – ₹7 lakh | Role-specific dashboards, advanced analytics and integrations. |
| Enterprise Dashboard | ₹7 lakh and above | Complex reporting, multi-tenancy, custom workflows and advanced security. |
These are illustrative planning estimates for dashboard-focused custom development, not fixed quotations. The complete SaaS application, backend services, mobile applications, hosting and third-party licences may require separate budgets.
Factors That Influence Development Cost
- Number of dashboard screens: More screens and user-specific layouts require additional design and development.
- Data complexity: Large datasets, advanced queries and historical analytics increase implementation effort.
- Real-time updates: Live data communication can require additional infrastructure.
- User roles: Different permissions and workflows increase testing and backend complexity.
- Third-party integrations: Payment systems, CRM platforms and external APIs add development work.
- Multi-tenancy: Tenant-specific dashboards and data isolation require additional architecture.
- Mobile responsiveness: Different device layouts and interaction patterns require testing.
- Security requirements: Audit logs, SSO and advanced access controls affect the project scope.
Common SaaS Dashboard Development Mistakes
- Displaying too many metrics without a clear business purpose.
- Using charts that do not suit the underlying data.
- Ignoring mobile and tablet users.
- Showing data that users do not have permission to access.
- Creating slow reports without suitable query optimisation.
- Using inconsistent layouts across application modules.
- Ignoring loading states, error messages and empty states.
- Failing to test dashboard calculations against actual business records.
How to Choose a SaaS Dashboard Development Company
Choosing an experienced software development partner can help ensure that the dashboard is useful, reliable and maintainable.
Before starting a project, consider these points:
- Experience developing custom business dashboards.
- Knowledge of frontend and backend technologies.
- Understanding of charts, reports and data visualisation.
- Experience with role-based access and SaaS architecture.
- Responsive UI/UX design capabilities.
- API integration and database development experience.
- Testing, deployment and ongoing maintenance support.
- Clear project scope, timelines and source-code ownership terms.
Why Choose Greap Technologies for SaaS Dashboard Development?
Greap Technologies provides website development, custom software development and digital growth solutions for businesses. We help plan and build business applications based on operational requirements and customer workflows.
Our software development services can include:
- Custom SaaS application development.
- Admin dashboard and management panel development.
- Business analytics and reporting dashboards.
- Multi-user and role-based application development.
- Multi-tenant SaaS platform development.
- CRM, ERP and business management software.
- API integrations and automation.
- Responsive web application development.
Whether you are developing a new SaaS product or improving an existing business application, we can help plan a dashboard that makes business information easier to manage.
Planning a Custom SaaS Dashboard?
Build a professional business dashboard with useful analytics, role-based access, responsive design and the features your application needs.
Discuss Your Project on WhatsApp Visit Greap TechnologiesCall: +91 70923 30168
Frequently Asked Questions
1. What is a SaaS dashboard?
A SaaS dashboard is an interactive interface within a cloud-based application that allows users to view business information, monitor performance, manage activities and access software features.
2. What are the essential features of a SaaS dashboard?
Important features include KPI cards, charts, user management, role-based permissions, notifications, reports, search filters, activity history, settings and responsive design.
3. How much does SaaS dashboard development cost in India?
A basic custom dashboard may cost approximately ₹75,000 to ₹1.5 lakh. Advanced dashboards with integrations, analytics and complex permissions can require a larger budget.
4. Which technology is best for SaaS dashboard development?
React.js, Next.js and Vue.js are popular frontend options. Laravel, Node.js and Python are possible backend choices. The best combination depends on the application requirements.
5. Can a SaaS dashboard display real-time data?
Yes. Real-time updates can be implemented using technologies such as WebSockets or server-sent events. For many applications, scheduled updates or manual refresh are sufficient.
6. Can different users have different dashboards?
Yes. A SaaS application can provide separate dashboards based on user roles, permissions, departments and responsibilities.
7. Is a mobile-responsive SaaS dashboard important?
Yes. Responsive dashboards allow users to access important information from smartphones and tablets, making business applications more convenient.
8. Can I integrate charts and analytics into my SaaS application?
Yes. Chart libraries and custom reporting modules can display sales trends, revenue information, customer activity, subscriptions and operational metrics.
9. What is the difference between an admin dashboard and an analytics dashboard?
An admin dashboard focuses on managing users, settings and application operations. An analytics dashboard focuses on presenting metrics, trends and reports. A SaaS application can combine both.
10. How long does SaaS dashboard development take?
A simple dashboard may take a few weeks, while a more advanced dashboard with multiple roles, integrations and reporting features may take several months. The actual timeline depends on scope and complexity.